Learn the Basics
In this article, we'll go walk through the platform's core functionality and how you can use the tool to learn more about our world. It's still in an early stage but we already offer unique visualizations you likely won't find outside of our site.
As you read this guide and start using the site, don't hesitate to reach out to us with questions, ideas and feedback. We're aiming to introduce a new "Explore" visualization each month this year and we'd love to hear what you'd find useful.
Explore
Start exploring our data at a global level. We currently have three categories; demographics, politics and economics. We plan to add additional charts within each category as well as introduce new categories entirely...
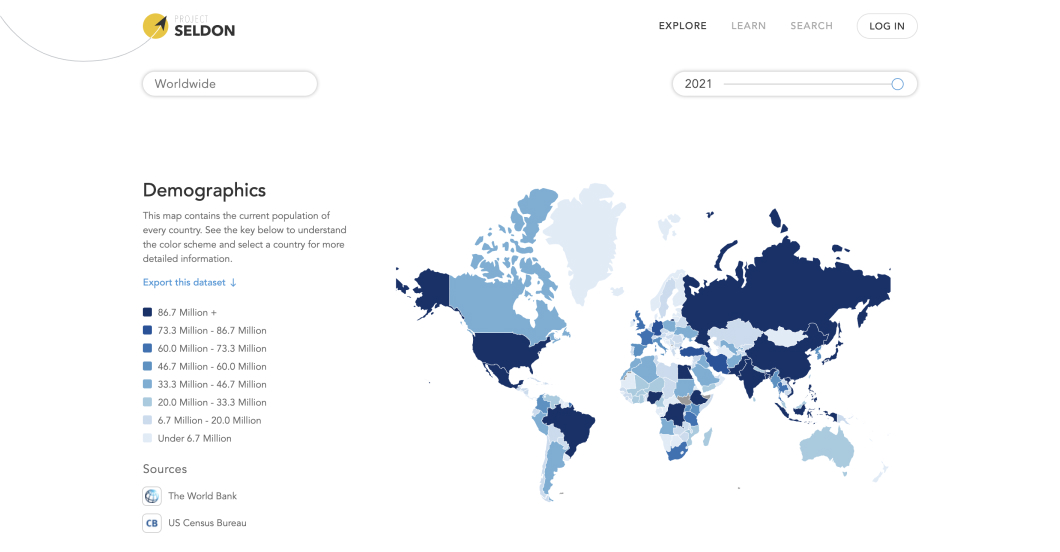
Each category has a key on the left consisting of a description, additional information and options. Most importantly, each key also contains the sources for the data used in corresponding chart.
Hovering over elements in the chart provides you with more information...
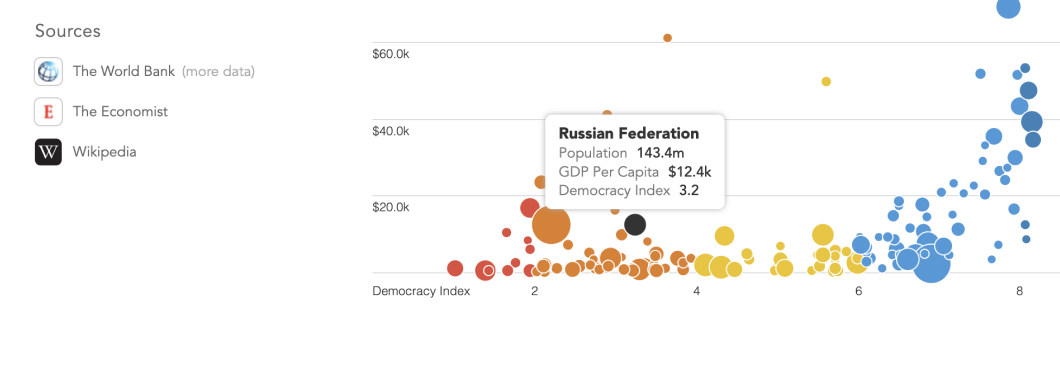
... and clicking any specific country allows you to drill down into a whole new set of country-specific visualizations, though still for the same three categories as on the initial worldwide page.
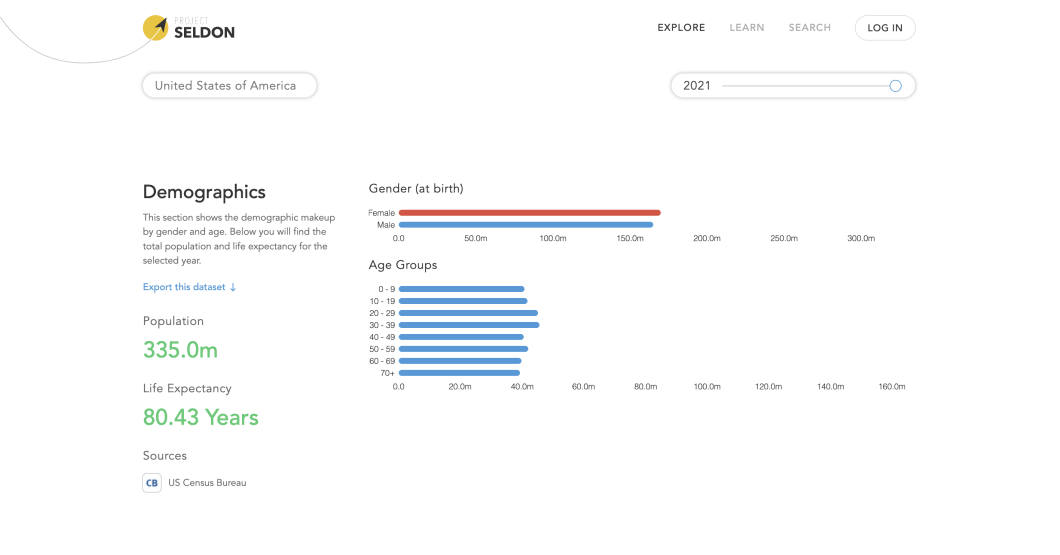
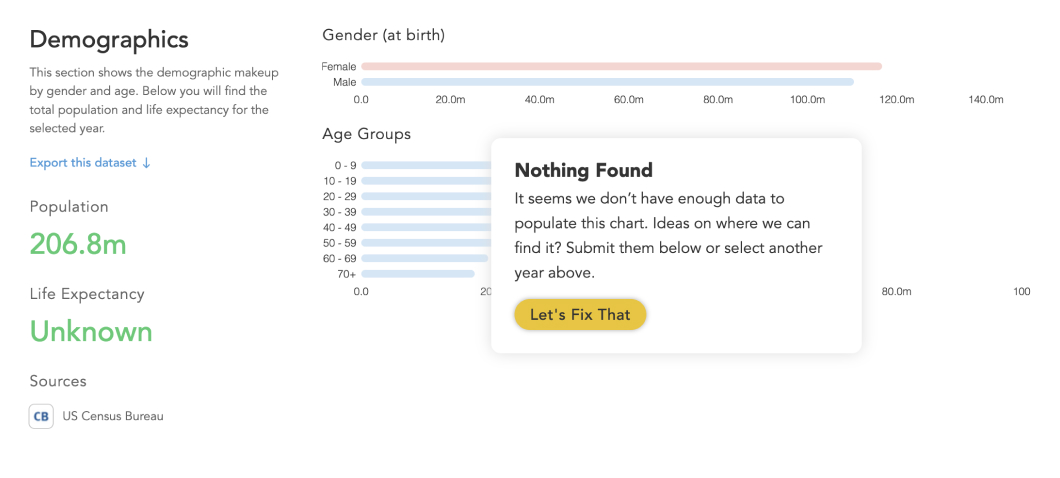
Note that this country-specific data is historical as well. You can drag the year selector to see a depiction of that category at any point within our dataset. Keep in mind though, not every category will have data for every year but you can reach out to us if you know where we can find it.
You can see some ideas for new sections and metrics here. Don't hesitate to comment or submit a new issue if you have thoughts!
Search
Search and filter through all the distinct entities (mostly elected officials as of right now) in our datasets. If you get an interesting set of results, copy the URL to share it or link it from your article...
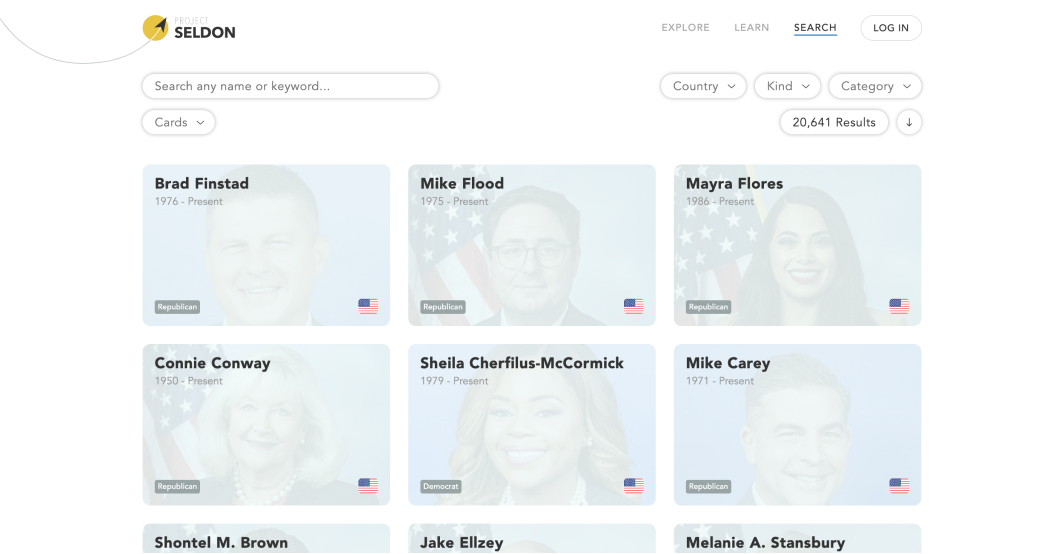
Click any search result to get more information; different types of results may bring you to different views. For example a country will bring you to the country-specific "Explore" page while an official will bring you to a page that contains a history of their roles and -- in some cases -- voting history.
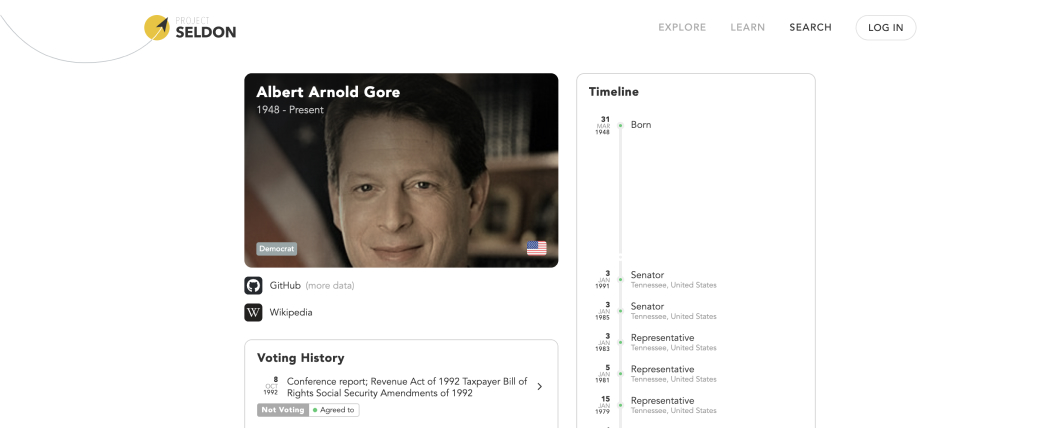
Our focus has been mainly on the "Explore" section so far but we do plan to add additional "Search" views soon.
Export
Given that -- at the time of writing -- all of our data is pulled from external sources and the data is about the societies we all live in, we feel that it's just as much yours as it ours.
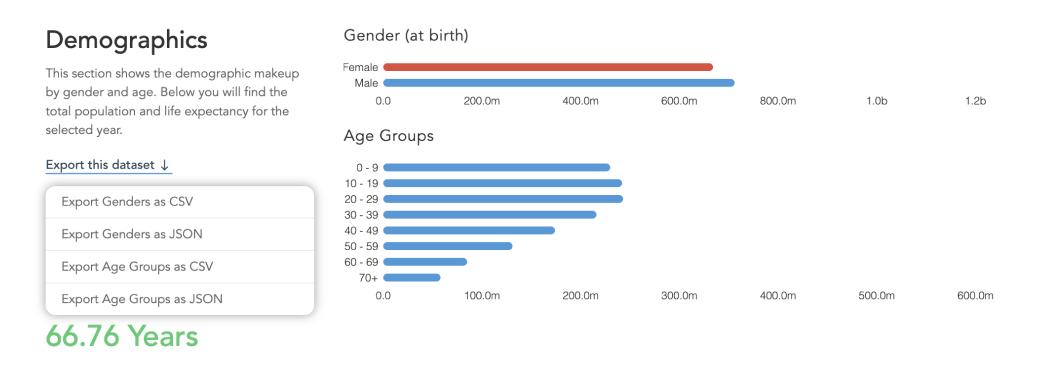
For this reason, we recently added export menus everywhere. These allow you to download basically any data you see throughout the application either as a CSV or JSON document. Here's an example of that in one of our "Explore" visualizations...
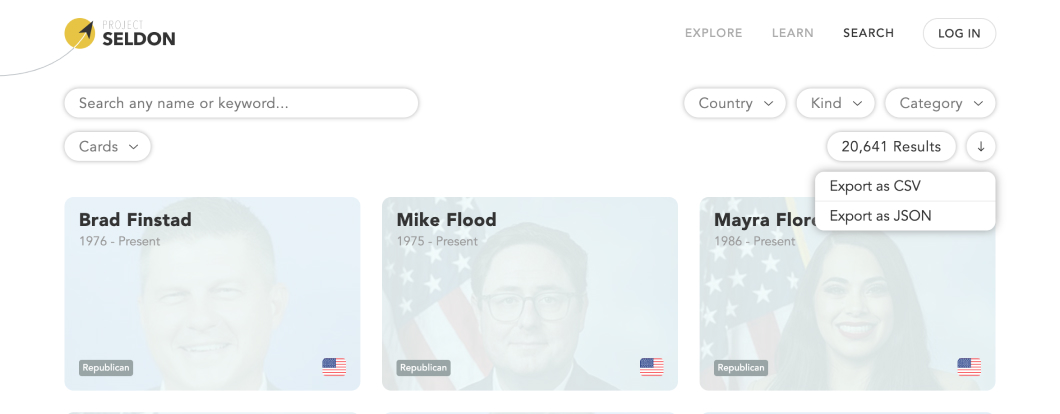
A similar export menu is also available on the "Search" page...
If you're in need of additional fields in the exports or interested in a full-fledged API, just reach out. We plan to expose an low-cost API for our data in 2023 but want to gauge interest first.